
Q3 2025 EdTech Market Report: Infrastructure Over Hype

.jpg)
After several quarters of retrenchment, the EdTech market is emerging leaner, more disciplined, and increasingly infrastructure-first.
I. The Rebalancing Moment
By mid-2025, the U.S. education technology market had settled firmly into its post-boom phase. The speculative energy of the pandemic era had bled off; the take-private wave of 2023–24 had receded from the headlines. In its place, investors and operators focused on the fundamentals that define durable software categories: measurable impact, disciplined capital allocation, and systems that keep institutions running.
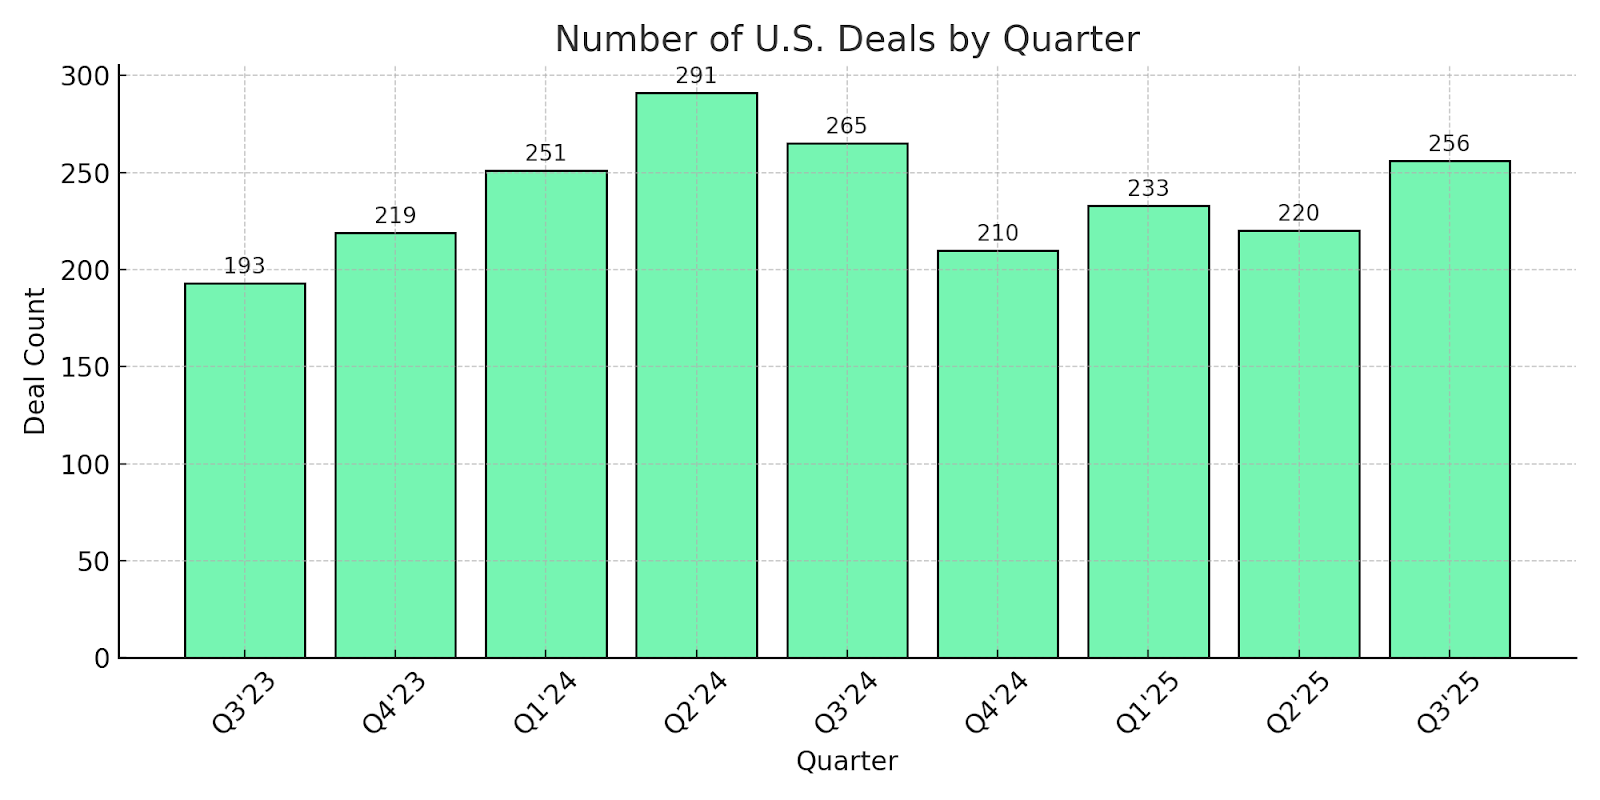
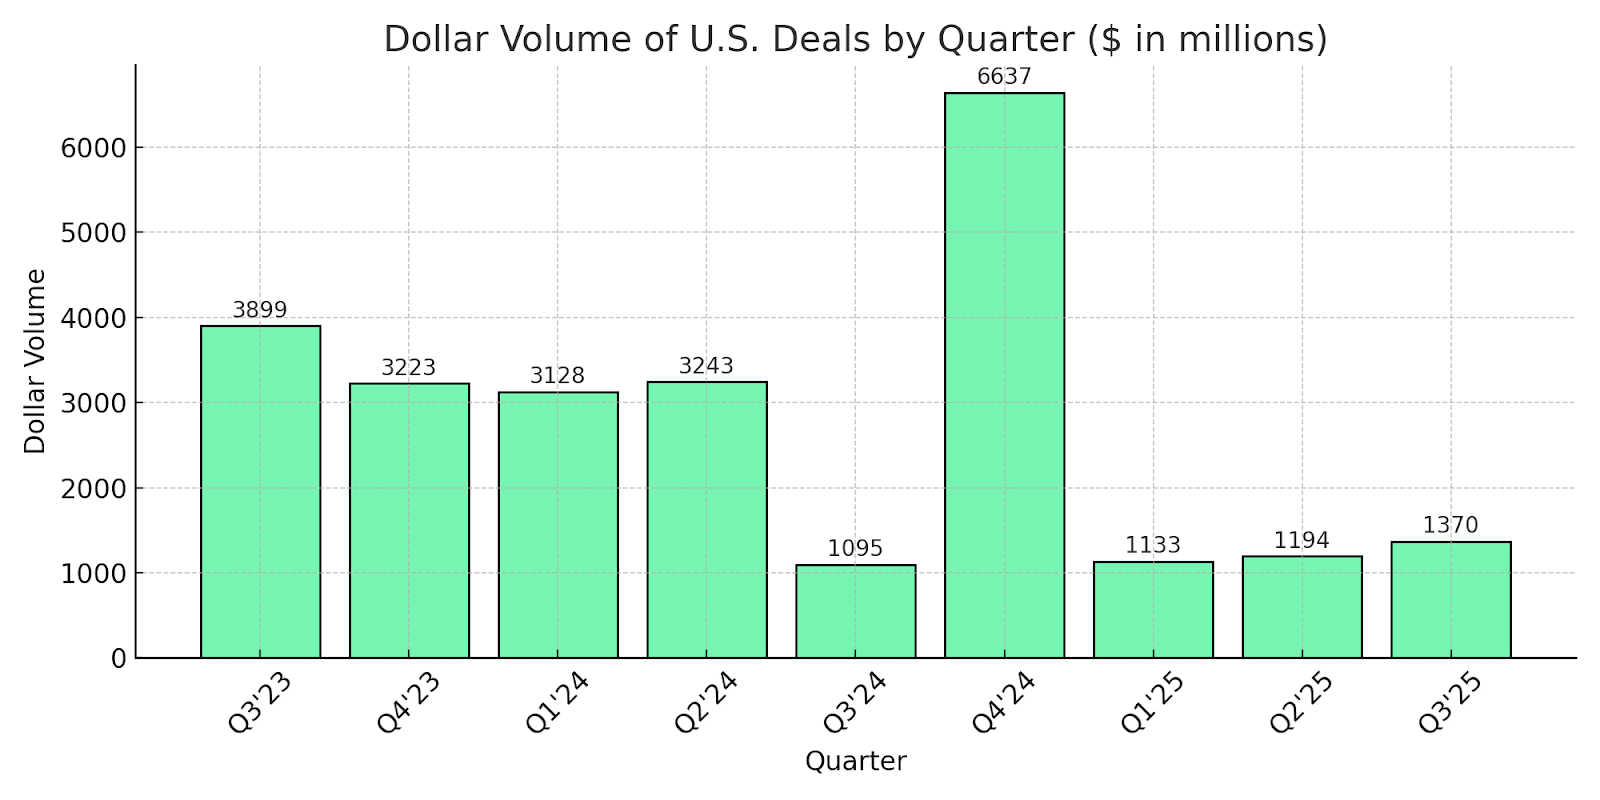
In Q3 2025, that discipline translated into renewed, but more selective, market activity. According to PitchBook, 256 U.S. EdTech transactions closed in the quarter, a 16% jump over Q2 and the highest deal count of the year. Total disclosed value reached $1.37 billion, not on the back of mega-deals, but through a meaningful rise in minority growth checks and structured expansion capital.
The composition of that activity mattered more than the count. Over three-quarters of transactions were non-control investments, signaling a clear preference for backing existing winners rather than funding risky land grabs. Investors are underwriting disciplined expansion: deeper product integrations, go-to-market scalability, and workflow extensions that increase account value without over-stretching balance sheets.
Structurally, the quarter marked the first true budgeting cycle of the post-ESSER, post-FAFSA-crisis era. Districts finalized their ESSER closeouts and set technology priorities for FY26. Higher-education leaders stabilized admissions and aid operations after two chaotic FAFSA cycles. In corporate learning, state and federal entities continued to flow dollars into apprenticeships and workforce innovation.
The result is a more measured, infrastructure-oriented market. EdTech remains investable, but the bar has risen: “proof of impact” has decisively replaced “potential for scale” as the central thesis for both buyers and builders.
The real signal, however, wasn’t just the rebound in deal value—it was its source. Minority private-equity checks and structured growth rounds dominated, together accounting for just over three-quarters of transaction value. This is classic “expansion capital”: investors buying into a clearer line of sight on retention, upsell, and operating leverage, rather than betting on unproven product-market fit.
Together, these dynamics confirm a market that has traded momentum for precision. Capital is still available and competitive—but it is flowing most readily to platforms that look and behave like core infrastructure.
II. Macro Trends: Scarcity as Strategy
The policy environment in Q3 reinforced that same discipline. The House FY26 Labor-HHS-Education appropriations proposal reflected a tighter fiscal stance, cutting the Department of Education’s budget by roughly 15% and Title I by 27%, while proposing to roll back nearly $1 billion in previously authorized Title I funds. Pell Grants remained flat, and Work-Study allocations were reduced by 37%, signaling heightened scrutiny for programs without clearly demonstrable ROI.
Yet this austerity was selective, not blanket. Funding for IDEA special education (+$26M), public charter school programs (+$60M), and career-technical education (+$25M) was preserved or modestly increased. The policy signal was unequivocal: fiscal restraint would continue, but evidence-backed initiatives would remain protected.
Regulation also moved. New Department of Education guidance proposed narrowing eligibility for Public Service Loan Forgiveness (PSLF), excluding programs deemed to have “substantial illegal purpose.” Institutions were told to prepare for disaggregated admissions reporting by race and sex beginning in the 2025–26 cycle—a shift that will ripple directly into enrollment analytics, compliance stacks, and admissions software.
All of this points in one direction: scarcity is now a strategy. With every public dollar tracked closely to outcomes, buyers in K–12, higher ed, and workforce learning are favoring platforms that offer:
- Compliance assurance
- Operational transparency
- Measurable, attributable outcomes
The vendors that win are those that can prove their value, not just pitch it.
III. K–12: Building After the Boom
In K–12, the post-stimulus reality is fully in view. With ESSER III deadlines behind districts and liquidation extensions tightly scoped, procurement shifted from experimentation to systems building. Leaders are replacing fragmented point solutions with fewer, better-integrated platforms that handle student data, attendance, staffing, and budgeting in one place.
Administrative and school operations software captured the largest share of deal activity in Q3, followed by online learning and LMS tools. Superintendents and procurement officers prioritized vendors that could:
- Plug into existing SIS and finance systems
- Demonstrate predictable implementation timelines
- Provide clear evidence of impact on compliance, attendance, or academic outcomes
State budgets reinforced the mood of pragmatic optimism. Highlights included:
- Colorado sustaining universal preschool and early-intervention investments
- Connecticut launching a $300 million childcare fund and a $36 million early childhood endowment
- Montana passing the $100 million STARS Act to raise teacher pay and expand career-technical education
- Texas advancing a dual-track model: $8.5 billion for general K–12 plus $1 billion for ESA accounts, with up to $30,000 per student with disabilities
- Nevada adding outcomes-based budget weighting and retention bonuses
Transaction activity reflected this infrastructure orientation. Network and security platforms like Ednetics changed hands, while Newsela’s $100 million acquisition of Generation Genius bolstered its position in digital content. Next Gen Web Solutions continued to expand its footprint in enrollment and aid workflows, blurring the edges between K–12 and higher-ed administrative stacks.
In public markets, cash-flow-positive operators with renewal-driven models continued to lead. Stride, trading at roughly 2.8x forward revenue and 11.6x EBITDA, outperformed peers, illustrating investor preference for predictable, subscription-heavy businesses. Digital penetration in K–12 remains below 5% of total spending, leaving room for measured, integration-driven expansion through 2026.
IV. Higher Education: Stability Before Strategy
Higher education entered Q3 on noticeably firmer footing. After two turbulent FAFSA cycles, the Department of Education confirmed that the 2026–27 FAFSA will launch on time, with a soft open on October 1 and full availability by December 1. With timelines normalized, institutions began to stabilize admissions, financial aid, and communications workflows.
Community colleges remained the standout, posting 3.2% year-over-year enrollment growth and marking a second consecutive quarter of gains. This resurgence is driving renewed institutional investment in:
- Student success and advising platforms
- Credentialing and transcript tools
- Integrated enrollment and financial-aid infrastructure
Transaction activity followed the workflow theme. RedShelf, a digital content platform, was acquired by a strategic buyer; Enroly, which automates international enrollment, also changed hands. These moves extended a broader cycle of consolidation, including Ellucian’s acquisition of EduNav, Instructure’s purchase of Parchment, and Transact’s roll-up under Roper Technologies—all aimed at tightening integrations around the student-lifecycle stack.
Institutions increasingly favor systems with clear ROI: platforms that unify academic planning, records, advising, and career placement, while reducing administrative overhead. The pandemic-era vogue for fully outsourced OPMs continues to fade, giving way to modular, first-party credential programs aligned with employer demand.
Public bellwethers again set the tone. Docebo outperformed earnings expectations, powered by AI-enabled enterprise deployments. Duolingo maintained its premium multiple on the strength of high engagement and subscription revenue. Sector medians held around 3.2x forward revenue / 14.7x EBITDA for EdTech and 2.1x / 9.3x for Education Services, underscoring a market that rewards durable, usage-anchored models over headline growth.
The forward path for higher ed is less about splashy transformation and more about system-level modernization: slow, methodical upgrades that improve resiliency and student outcomes.
V. Workforce Learning: The Sector’s Growth Anchor
While K–12 and higher ed focused on incremental refinements, workforce learning remained the clearest growth engine in Q3. Though it represented around 10% of total deal count, the segment drew an outsized share of investor attention, thanks to its tight coupling to employer needs and measurable ROI.
In July, the U.S. Department of Labor announced $84 million in new apprenticeship grants, funding programs across nearly every state and several territories. In parallel, the EU’s Pact for Skills reported 6.1 million workers trained since 2020. In both regions, public funding is flowing directly into ecosystems that prioritize credentialed learning and job placement.
M&A activity targeted stackable capabilities. Ascendient Learning and Babington were acquired for their depth in healthcare and business training, respectively. Cornerstone’s earlier acquisition of Talespin showed how immersive technologies are being embedded into enterprise LMS platforms to power soft-skills training, simulation, and scenario-based learning.
Public markets echoed these themes. Docebo reported strong enterprise demand across compliance and frontline-skill use cases, while Udemy Business maintained double-digit growth. The metrics that attracted capital were consistent:
- Verified skill improvement
- Retention and engagement uplift
- Faster, more effective onboarding
Strategically, the vertical EdTech thesis is accelerating. Industry-specific stacks in legal, automotive, and healthcare education are emerging as infrastructure layers—tying together content, assessment, credentialing, and compliance. AI is increasingly used to reduce content costs and improve assessment fidelity, further reinforcing margins.
To investors, workforce learning now looks like classic enterprise SaaS: sticky, low-churn, and expansion-friendly. With rising LTV/CAC ratios and ample bolt-on pathways, it has become a prime consolidator arena.
VI. Investment Discipline: Metrics Over Momentum
Q3 reinforced what the last several quarters have hinted at: the EdTech investor playbook has permanently shifted. The days of “growth at any cost” are over; today’s leaders win on metrics, not marketing.
Across K–12, higher ed, and workforce learning, top-tier investors are concentrating capital in companies that can show:
- Net revenue retention above 110%
- Implementation payback within 12 months
- Clear, measurable impact on student outcomes, operational efficiency, or employer ROI
The best-performing assets—public and private—are those that solve compliance pain, streamline workflows, or deliver skill-based progression with verified outcomes. Flashy front-end tools with vague usage metrics are struggling to raise, or even to renew.
Macro projections remain supportive. HolonIQ estimates global digital education spend will reach $404 billion this year, roughly 5% of total education spending. In the U.S., EdTech revenues are projected to grow from $187 billion in 2025 to $348 billion by 2030, a 13.3% CAGR. Within that expanding pie, capital is clustering around infrastructure:
- Systems of record and enrollment engines
- Payment and billing stacks
- AI-enabled productivity tools for teachers, administrators, and workforce managers
- Vertical credential and simulation platforms with strong compliance narratives
Capital is more selective, but it is far from absent. High-retention, outcome-verified companies still command premium multiples, and the path to value creation is clearer than it has been in years: grow deliberately, integrate deeply, and prove your worth.
VII. Outlook: Precision Over Pace
Looking ahead, EdTech is likely to behave more like traditional enterprise software than a speculative growth story: slower headline expansion, higher quality revenue, and persistent infrastructure investment.
In K–12, leaders will continue consolidating point solutions into broader operational suites. Vendors that offer transparent usage analytics and tie product adoption to academic or budget outcomes will gain the edge in increasingly competitive RFPs.
In higher education, the normalization of financial-aid and enrollment cycles will support incremental reinvestment in the student-success stack—aid management, advising, degree planning, and outcomes reporting. Expect continued growth in modular, employer-aligned credential programs, particularly in fields with clear workforce demand.
In workforce learning, the trajectory is clearest. Employers will keep funding tools that deliver skill gains, compliance assurance, and internal mobility. We should see further bolt-ons and vertical integrations, with learning platforms functioning less as content providers and more as talent infrastructure.
Deal volume may remain below pandemic highs—likely under 250 U.S. transactions per quarter on average—but the quality of capital will continue to rise. Minority growth rounds, structured investments, and targeted platform acquisitions will dominate through 2026. Companies that clear the high bar on retention, impact, and payback will find robust, competitive demand.
Digital penetration in education is still low, but conviction is growing. As system leaders at districts, colleges, and employers prioritize durable value over novelty, EdTech is entering its most stable phase to date—no longer a speculative bet on the future, but critical infrastructure for how learning happens today.
References
Docebo, Inc. (2025). Q3 2025 financial results. Docebo.
EdSurge. (2023–2025). Coverage of EdTech take-private transactions and post-pandemic consolidation cycles.
Ednetics. (2025). Acquisition announcement. PR Newswire.
Forbes. (2024–2025). EdTech Funding and Market Reset Analyses.
HolonIQ. (2025). 2025 Global Education Market Update.
HolonIQ. (2025). Global Digital Education Spend Forecast (2025–2030).
National Student Clearinghouse Research Center. (2025). Current term enrollment estimates. NSC Research Center.
Newsela. (2025). Newsela acquires Generation Genius for $100 million [Press release]. Newsela.
Next Gen Web Solutions. (2025). Corporate acquisition and product expansion updates. Next Gen Web Solutions.
PitchBook Data, Inc. (2025). U.S. EdTech Market Report: Q3 2025 Transaction Activity.
Stride, Inc. (2025). Q3 2025 earnings report. Stride.
U.S. Department of Education. (2025). Federal Student Aid: 2026–27 FAFSA launch guidance.
U.S. Department of Labor. (2025). Apprenticeship Building America grant awards.
.png)
